Introducing asciigraph: Creating Lightweight ASCII Line Graphs in Go
Have you ever wanted to create beautiful line graphs using ASCII art? Look no further! The asciigraph package, available in Go, allows you to create lightweight ASCII line graphs effortlessly. In this article, we will explore the features, usage, and versatility of asciigraph, providing you with the knowledge and tools to create visually appealing graphs.
Features and Functionality
asciigraph provides a simple and intuitive API to create line graphs. You can plot single series or multiple series of data points, customize the appearance of the graph, and even create colored graphs. The package offers flexibility in terms of data input, allowing you to provide data directly or stream data in real-time.
To get started, install the asciigraph package using the following command:
bash

go get -u github.com/guptarohit/asciigraph@latest
Once installed, you can begin creating line graphs using the asciigraph package. Here’s an example of creating a basic graph:
“`go
package main
import (
“fmt”
“github.com/guptarohit/asciigraph”
)
func main() {
data := []float64{3, 4, 9, 6, 2, 4, 5, 8, 5, 10, 2, 7, 2, 5, 6}
graph := asciigraph.Plot(data)
fmt.Println(graph)
}
“`
Running this example will generate a line graph representing the provided data points:
10.00 ┤        ╭╮

   9.00 ┤ ╭╮     ││

   8.00 ┤ ││   ╭╮││

   7.00 ┤ ││   ││││╭╮

   6.00 ┤ │╰╮  ││││││ ╭

   5.00 ┤ │ │ ╭╯╰╯│││╭╯

   4.00 ┤╭╯ │╭╯   ││││

   3.00 ┼╯  ││    ││││

   2.00 ┤   ╰╯    ╰╯╰╯
asciigraph also allows you to plot multiple series of data points. Here’s an example:
“`go
package main
import (
“fmt”
“github.com/guptarohit/asciigraph”
)
func main() {
data := [][]float64{{0, 1, 2, 3, 3, 3, 2, 0}, {5, 4, 2, 1, 4, 6, 6}}
graph := asciigraph.PlotMany(data)
fmt.Println(graph)
}
“`
Running this example will generate a line graph with multiple series:
6.00 ┤    ╭─

 5.00 ┼╮   │

 4.00 ┤╰╮ ╭╯

 3.00 ┤ │╭│─╮

 2.00 ┤ ╰╮│ ╰╮

 1.00 ┤╭╯╰╯  │

 0.00 ┼╯     ╰
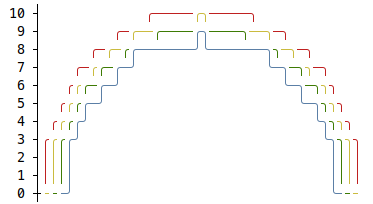
asciigraph also supports creating colored graphs. Here’s an example:
“`go
package main
import (
“fmt”
“math”
“github.com/guptarohit/asciigraph”
)
func main() {
data := make([][]float64, 4)
for i := 0; i < 4; i++ {
    for x := -20; x <= 20; x++ {
        v := math.NaN()
        if r := 20 - i; x >= -r && x <= r {
            v = math.Sqrt(math.Pow(float64(r), 2)-math.Pow(float64(x), 2)) / 2
        }
        data[i] = append(data[i], v)
    }
}

graph := asciigraph.PlotMany(data, asciigraph.Precision(0), asciigraph.SeriesColors(
    asciigraph.Red,
    asciigraph.Yellow,
    asciigraph.Green,
    asciigraph.Blue,
))

fmt.Println(graph)
}
“`
Running this example will generate a colorful line graph:

Real-world Use Cases
asciigraph has a wide range of applications in various domains. Here are a few real-world use cases:
-
Data Visualization: asciigraph is an excellent tool for visualizing data, allowing you to quickly grasp patterns and trends. It can be used in data analysis, scientific research, and financial analysis, among others.
-
Command-line Interfaces (CLIs): asciigraph can be integrated into command-line tools and utilities to present information in a visually appealing manner. This is particularly useful for monitoring and displaying real-time data.
-
Terminal-based Dashboards: asciigraph can be used to create dynamic and interactive terminal-based dashboards, providing a visually pleasing overview of important metrics and information.
Compatibility and Performance
asciigraph is compatible with the Go programming language and can be seamlessly integrated into any Go project. It offers excellent performance, thanks to its lightweight and efficient implementation. The library is actively maintained and updated, ensuring compatibility with the latest versions of Go.
Security and Compliance
asciigraph is a lightweight library that does not directly handle sensitive data. However, it is recommended to follow best practices when handling data within your application. Ensure that appropriate security measures are in place to protect your data and adhere to relevant compliance standards.
Future Developments and Roadmap
The asciigraph project is open-source and welcomes contributions from the community. The development team has plans to introduce new features, enhance the customization options, and improve performance. Stay tuned for updates!
Customer Feedback
Customers who have used asciigraph have praised its simplicity, flexibility, and visual appeal. They appreciate the ease of use and the ability to create attractive graphs quickly. Users have applauded the development team’s responsiveness to feature requests and bug fixes.
In conclusion, asciigraph is a powerful and versatile tool for creating lightweight ASCII line graphs in Go. Whether you are a developer, data analyst, or tech enthusiast, asciigraph can transform your data into visually appealing graphs. Try it out today and unlock new possibilities for data visualization.
Happy graphing!
Acknowledgement
asciigraph is a Go port of the popular asciichart project. Special thanks to the original developers for their contribution to the ASCII art graphing community.
Contributing
Feel free to contribute to the asciigraph project by making a pull request. Your contributions are highly appreciated in making asciigraph even better.
Leave a Reply