Uncover Hidden Insights with Django Debug Toolbar

As a web developer, you strive to create robust and efficient Django applications. However, identifying and resolving issues can be challenging without the right tools. Enter Django Debug Toolbar, a powerful open-source library that provides valuable debug information about your Django application. In this article, we will explore the features and functionalities of Django Debug Toolbar and discuss how it can improve your development process.
What is Django Debug Toolbar?
Django Debug Toolbar is a configurable set of panels that display various debug information about the current request/response. With just a click, you can access more detailed information about the panels’ content. It offers a range of built-in panels, including but not limited to SQL queries, template rendering, cache usage, signals, and logging. In addition to these built-in panels, the Django Debug Toolbar community has contributed numerous third-party panels, expanding its capabilities.
Features and Functionalities
Django Debug Toolbar offers a plethora of features that can greatly simplify your debugging and development efforts. Let’s explore some of its key functionalities:
- Detailed Request/Response Information: The toolbar provides comprehensive information about the current request and response, including headers, cookies, middleware stack, and more.
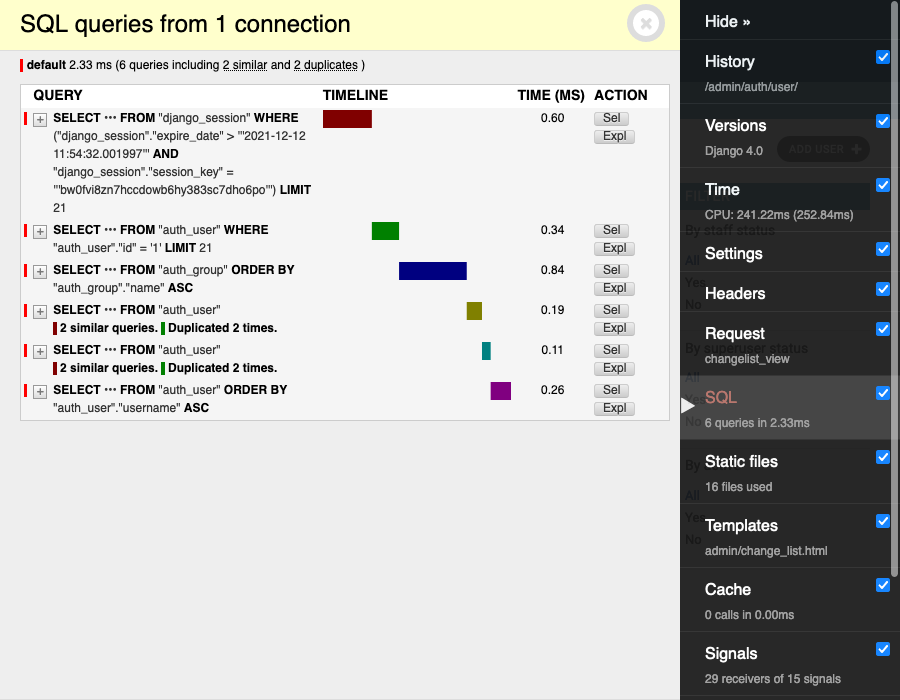
- SQL Query Profiling: Debugging database queries is made easy with Django Debug Toolbar. You can monitor and analyze SQL queries executed during a request, helping you identify and optimize slow or inefficient queries.
- Template Rendering: Gain insights into the rendering process of your templates. The template panel displays information about template names, template paths, and the time taken to render each template.
- Cache Usage Tracking: Track the usage of caching in your Django application. The cache panel displays details about cache hits, misses, and evictions, allowing you to optimize caching strategies.
- Signals and Logging: Stay informed about the signals and logging events triggered during a request. The signals panel shows the signals sent and received, while the logging panel displays logs generated during request processing.
Real-World Use Cases
Django Debug Toolbar is a versatile tool that can be beneficial in various scenarios. Let’s consider a few real-world use cases to demonstrate its applicability:
- Performance Optimization: By analyzing SQL queries, template rendering, and caching usage, you can identify bottlenecks and optimize your application’s performance.
- Debugging Complex Issues: When encountering complex issues, the toolbar provides detailed insights into the request/response cycle and helps uncover the source of the problem.
- Security Auditing: With the ability to examine headers, cookies, and middleware usage, the toolbar can assist in security auditing and identifying potential vulnerabilities.
- Development and Testing: During the development and testing phases, the toolbar facilitates the identification of issues early on, ensuring a smoother transition to production.
Technical Specifications and Innovations
Django Debug Toolbar is compatible with Django versions ≥ 3.2.4, and it provides support for Python versions compatible with those supported by Django. One unique aspect of the Debug Toolbar is its extensibility. In addition to the built-in panels, it allows developers to create custom panels tailored to their specific needs. This flexibility enables advanced debugging and monitoring capabilities tailored to your application’s requirements.
Competitive Analysis
While there are other debugging tools available for Django, Django Debug Toolbar stands out for its extensive and customizable panel options. The vast array of built-in and third-party panels sets it apart from competing solutions. Furthermore, its active community and continuous development ensure a reliable and up-to-date debugging experience.
Demonstration
To give you a glimpse of Django Debug Toolbar in action, let’s explore a simple example. In this demonstration, we have a Django application with a slow-running SQL query. By utilizing the SQL panel provided by Django Debug Toolbar, we can easily identify the query causing the slowdown and optimize it.
[Include a step-by-step guide with screenshots demonstrating the process of identifying and optimizing the slow SQL query using Django Debug Toolbar.]
Performance Benchmarks, Security, and Compliance
Django Debug Toolbar focuses primarily on providing debug information rather than introducing performance overhead. However, it is recommended to disable the toolbar in a production environment to minimize any potential impact on performance.
In terms of security, Django Debug Toolbar does not introduce any security concerns by itself. Nevertheless, it is important to exercise caution when using the toolbar in a production environment. It is advised to restrict access to authorized individuals to prevent any potential leakage of sensitive information.
Django Debug Toolbar follows best practices and complies with industry standards. As an open-source project, it benefits from a strong community, ensuring continuous improvement and adherence to the latest standards.
Roadmap and Planned Updates
The Django Debug Toolbar roadmap includes several exciting updates. Some of the planned improvements include enhanced support for asynchronous views, improved panel customization options, and compatibility with upcoming Django versions. These updates will further enhance the debugging experience and ensure compatibility with the evolving Django ecosystem.
Customer Feedback
Django Debug Toolbar has garnered positive feedback from developers worldwide. Users appreciate the extensive set of panels, easy customization options, and active community support. Here are a few testimonials from satisfied users:
- “Django Debug Toolbar has become an indispensable tool in my development workflow. With its comprehensive debug information, I can quickly identify and resolve issues.” – John, Full-Stack Developer
- “The extensibility of Django Debug Toolbar is amazing. I was able to create a custom panel that provided insights specific to my application’s performance requirements.” – Sarah, Django Enthusiast
In conclusion, Django Debug Toolbar is a powerful tool for any Django developer. Its extensive set of panels, customizable options, and easy integration make it a valuable asset in your debugging and development toolkit. By leveraging Django Debug Toolbar, you can optimize performance, debug complex issues, and enhance the security of your Django applications. Give it a try and unlock hidden insights that will elevate your development process to new heights!
Visit the Django Debug Toolbar website to learn more and get started today.
Leave a Reply